ANAEROBIC FERMENTATION
Most of the organics in the sewage sludge were transformed into useful energy by the anaerobic fermentation of microorganism. Plenty of nitrogen, phosphate, potassium could be separated from the leachate produced in this fermentation which makes the recycling of sewage sludge much easier. This method could also help stabilize and decrease the amount of sewage sludge and make it harmless.
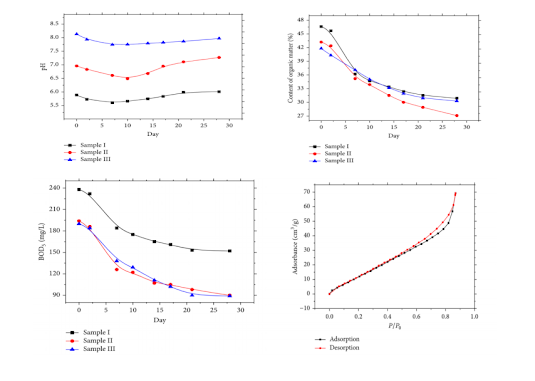
Here is a brief account on the mechanism of this process. The sewage sludge samples are taken in conical flasks; the flasks were sealed and kept in an airtight and anaerobic condition. Then the conical flasks were kept in thermostatic water bath box, controlling the temperature at 95°C to improve the efficiency of the anaerobic fermentation of the sewage sludge. The conical flasks were taken out and put into a container with oxygen at the 2th, 7th, 10th, 14th, 17th, 21th, and 28th day after the beginning of the anaerobic fermentation, respectively. When the flasks were taken out, a little of the sewage sludge was taken out and a filter screen was put on the bottleneck of the flask. Then, the leachate in the flask was poured into a small beaker. Then the flasks were sealed again and put back into the water bath box. After 28 days of fermentation the sample will undergo several tests: - pollutant releasing test, static nitrogen adsorption test, TG-DTA test. And after the test it was found that the PH values were consistent before and after fermentation while there was a drastic decline in the organic content and BOD5 of the sludge helping them in easy breakdown. In the fermentation of sewage sludge, the microorganism could significantly digest the organics in the sewage sludge. Also the pore size increased – increasing the adsorption rate.
To study the releasing rules of the pollutant, microstructure, the phase deformation, and the component of the sewage sludge in the anaerobic fermentation and to find theoretical foundation for the use and harmless disposal of the sewage sludge, the pollutant releasing test, the static nitrogen adsorption test, and the TG-DTA test were performed to determine the concentration of pollutant, pore structure, and properties in the thermal effect of the sewage sludge with differently original pH value on the anaerobic fermentation. From the test results, the conclusions can be drawn as follows.
(1) The pH value of samples declined firstly and then increased with the continual of the fermentation. The difference values between the original pH value and the final pH value of samples I and III were both smaller than 2%, while the difference value of sample II was 4.5%. The contents of organic and the BOD5 both gradually decreased with the continual of the fermentation, and the decreasing rate during 2–15 days of the fermentation was relatively high. At the end of the test, the content of the organic and the BOD5 of sample II declined most which were 37.3% and 53.6%, respectively, and they were still slowly decreasing.
(2) The adsorption isotherms of sewage sludge in the anaerobic fermentation belonged to kind IV, and there existed a H3 kind hysteresis loop in the curve. The maximum amount of adsorption was 69.24 cm3/g. The proportion of pore smaller than 6 nm was large and the curve of total pore volume was similar to a line. The maximum values of total pore volume were between 0.126 and 0.178 cm3/g. With the increasing of the time of the anaerobic fermentation, the average pore size of sample particles increased 16.0–19.8%, and the total pore volume also slightly increased. In the same time of the fermentation, the specific surface area of sample II was smaller and the average pore size was larger than that of samples I and III.
(3) When the temperature was between 0 and 200°C, the mass loss of sewage sludge samples was 32.9–39.1% and there existed significant endothermic valley since the dehydration of free water. When the temperature was between 200 and 600°C, the mass of sewage sludge decreased a little and there existed two exothermal peaks because of the oxidative cleavage and the burning of organics. When the temperature was higher than 600°C, the TG and DTA curves were more smoothly. In the curves of the samples at 14th day of fermentation, there appeared an obvious fluctuation at the endothermic valley and the peak value of the exothermal peak was comparatively large. At the same time of the heating procedure, the mass loss and endothermic valley and the exothermal peak of sample II were all larger than those of samples I and III.
Reference : https://www.hindawi.com/journals/jchem/2015/901021/

Nice 👍
ReplyDeleteUnique Work
ReplyDeleteReally informative....
ReplyDelete👏👏👏👏👏
ReplyDeleteGood job 👍 👌👏👏
ReplyDeleteGood work
ReplyDeleteExcellent Work
ReplyDeleteFantastic
ReplyDeleteKeep it up!!
ReplyDeleteGood job
ReplyDeleteNice!
ReplyDeleteGood!
ReplyDeleteVery informative and am yet to read the other blogs
ReplyDeleteGreat job
ReplyDelete